Downloadable Documents & Helpful Links
- NRCS Press Release on 2015 Funding for Edge of Field Monitoring
- NRCS Practice Standards for Edge of Field Monitoring:
- NRCS Phosphorus Removal System Interim Standard (782)
- Year 1 Edge of Field Study Interim Report
- Year 2 Edge of Field Study Interim Report
- Edge of Field Study Final Report (pdf)
- Miner Institute Research Page (link)
Introduction to Edge of Field Studies
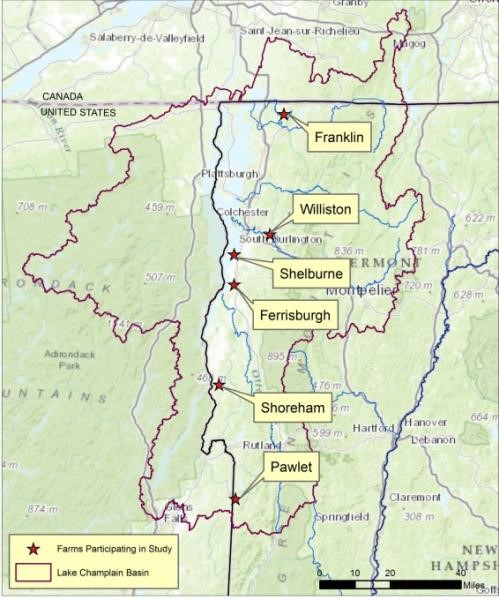
In 2012, six farmers throughout the Lake Champlain Basin signed up with the NRCS to study the effect of implementing conservation practices on edge of field nutrient losses. These original study sites conformed to NRCS practice standard 799, which were later replaced by conservation activity codes 201 and 202 (links to standards can be found above). In 2015 an additional farm began monitoring under the new NRCS standards.
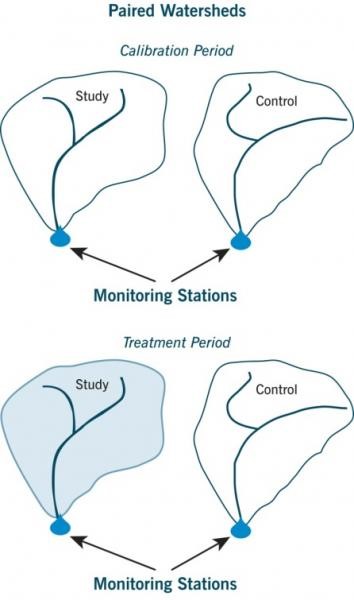
All of the sites utilize a paired watershed design, which establishes the natural relationship between two watersheds similar in size and land use, known as the “calibration” period. Following the USDA-NRCS practice standard the monitoring effort is in the calibration period for 1 year, and is followed by 2 years of “treatment”, where one watershed has a BMP installed (“treatment” watershed) and the other does not (“control” watershed). After two years in the treatment phase, the effectiveness of the BMP that was installed in the “treatment” watershed will be assessed. The new monitoring standards under NRCS conservation codes 201 and 202 require a minimum of 5 years of monitoring rather than 3, which correlate to 2 years of control and 3 years of treatment. Indeed, we found that 3 years was too short to establish correlations between the watersheds, and most of the sites were extended to have an additional year of monitoring.
Approximate Locations of Participating Farms:

Conservation Practices Evaluated
- Cover cropping on corn ground (1 farm)
- Conservation System: manure injection and conservation tillage on ground (1 farm)
- Soil aeration on hayland prior to manure application (3 farms)
- Waste and Sediment Control Basin (WASCoB) (1 farm)
- Grassed Waterway (New 2015) (1 farm)
Primary Parameters Monitored and Analyzed
- Total Phosphorus (TP)
- Total Dissolved Phosphorus (TDP)
- Total Nitrogen (TN)
- Total Dissolved Nitrogen (TDN)
- Chloride
- Total Suspended Solid (TSS)
- Soluble Reactive Phosphorus (SRP) (New 2015)
- Total Event Discharge
Secondary Parameters Being Monitored
- Precipitation
- Air Temperature
- Runoff Specific conductance
- Runoff temperature
Paired Watershed Design:

Preliminary Trends
Events closely following manure application can produce very high nutrient concentrations in runoff (application timing relative to rainfall is critical). Exceptionally high event mean concentrations (EMC) of Total Phosphorus (TP) (15,560 µg/L), Total Dissolved Phosphorus (TDP) (15,140 µg/L), Total Nitrogen (TN) (100.6 mg/L), and Choride (Cl-) (155 mg/L) were measured at a monitoring station on December 6, 2013, which began shortly following manure application. This was the only paired event at any site that closely followed manure application and the EMCs were far higher than any observed at the other stations. Such phosphorus concentrations are similar to levels typically observed in untreated wastewater.
The mass of phosphorus lost in runoff was a small fraction of the amount applied in manure even when runoff immediately followed manure application. Despite the close timing after manure application of an event near Ferrisburgh and the exceptionally high TP and TDP concentrations measured, the Phosphorus (P) mass lost in runoff was only a small fraction of the P applied in manure, between 1.7% and 2.3%. Approximately 98% of the P applied in manure remained on the field. This comparison was made with the expectation that this event should approximate “worst case” conditions for nutrient wash-off and transport. If possible, this analysis will be repeated for selected rain events in 2014 to confirm this preliminary finding.
TP EMCs were lowest from the well-established hay-field watersheds, but were still high relative to surface water quality criteria. Despite the low nutrient inputs and low erosion rates on these permanent hay fields, TP event mean concentrations (mean = 249 µg/L and 312 µg/L at two Shelburne sites), while lower than from any other study watersheds, were nonetheless roughly an order of magnitude higher than proposed criteria for wade-able streams in Vermont and roughly 20-30 times higher than relevant in-lake criteria for Lake Champlain (14 µg/L for Shelburne Bay and 10 µg/L for the Main Lake segment).
Event mean concentrations of TP and TDP are positively correlated with soil phosphorus levels. Among the study watersheds, there is a reasonably strong relationship between the soil phosphorus mass data (in pounds per acre) and event mean concentrations of TP in runoff. Composite soil samples were collected from the study watersheds between October and December 2012 and were analyzed by both USDA Agricultural Research Service Grassland Soil and Water Research Laboratory (Temple, TX) and the University of Vermont Agricultural and Environmental Testing Laboratory. Through 2013, both total P and inorganic P in soil were positively associated with median TP EMCs in runoff, with R2 values of 0.79 and 0.82, respectively. Total and inorganic P levels in soil explained less of the observed variance in median TDP EMCs (R2 = 0.33 for total soil P and R2 = 0.35 for inorganic soil P).
Nitrogen EMCs appear to reflect fertilizer N inputs. The high N concentrations in runoff from two watersheds in Franklin County (mean EMCs = 5.7 mg/L and 6.1 mg/L) likely reflect high inputs; in both 2012 and 2013, the application rates of commercial nitrogen fertilizer at these sites were far higher than in the other study watersheds. Nitrogen concentrations in runoff from a watershed being studied that is in permanent hay field to which no commercial fertilizer and very little manure was applied, have generally been the lowest and least variable among the monitored fields (mean EMCs = 1.5 mg/L and 1.3 mg/L from two permanent hay fields).
Higher Total Suspended Sediment (TSS) EMCs were measured in runoff from corn fields than from hay fields. The watersheds planted to corn have generally recorded the highest and most variable TSS EMCs (mean TSS EMCs = 48.3 mg/L to 145.9 mg/L). TSS concentrations have been lowest and least variable at permanent hay sites (mean TSS EMCs < 30 mg/L), suggesting markedly lower erosion rates.
Over all seven projects the major portion of P in runoff was in the dissolved form (TDP). On the average across all monitored stations, about 65 percent of TP has occurred as TDP. Although they have occasionally exhibited high proportions of TDP, the all-corn watersheds have generally shown the lowest percentage of dissolved P, with one site averaging 50 percent or lower dissolved P and sometimes less than 10 percent. Conversely, all hay sites have tended to have the highest proportion of dissolved P, with TDP comprising almost 100 percent of TP on some events. Finding that the majority of P leaving these fields in the dissolved form has significant implications as to how we should manage manure and in the selection and design of BMP’s to reduce losses of P to our surface waters.
The proportion of Nitrogen in the dissolved form was generally high at all sites. On average, nearly 75 percent of TN measured at the paired watershed monitoring stations occurred as TDN. All but two stations expressed 100 percent of TN in the dissolved form at times.
Poorer than expected performance by the WASCoB. Aggregated over the 2013 monitoring season, changes in constituent loading between the WASCoB inlet and outlet were small, less than +/- 10 percent for TP, TN, and TDN. The TDP load was 33 percent lower at the outlet and the TSS load was 31 percent higher. Possible explanations for the apparent lack of consistent nutrient reductions include: 1) the lack of vegetation along the sides of the WASCoB may have resulted in sediment erosion into the WASCoB and limited filtering function; 2) nutrients may circumvent WAS1, entering the WASCoB through direct runoff or groundwater flow; and 3) the WASCoB may have insufficient hydraulic capacity to allow settling of solids, given the size of the watershed and its fine textured soils. The WASCoB volume when filled to the spillway elevation is approximately 3,900 cubic feet. The inflow at WAS1 represented between 4 times (Event 5) and 32 times (Event 1) the volume of the WASCoB (assuming it was full to the spillway), suggesting that time for solids settling was likely inadequate during some events.
Other Studies:
In addition to the monitoring efforts described here, VAAFM supports and follows closely related research being done by other entities. Such research includes research on phosphorus being done by the Friends of Northern Lake Champlain (FNLC), Stone Environmental, Inc., and local farmers. This study is partially funded through an NRCS Conservation Innovation Grant received by the FNLC. Additionally, the William H. Miner Agricultural research Institute in Chazy, NY engages in various edge of field monitoring efforts, including monitoring the effects of tile drainage management on nutrient exports. All of these efforts help or will help inform VAAFM policy and programs.
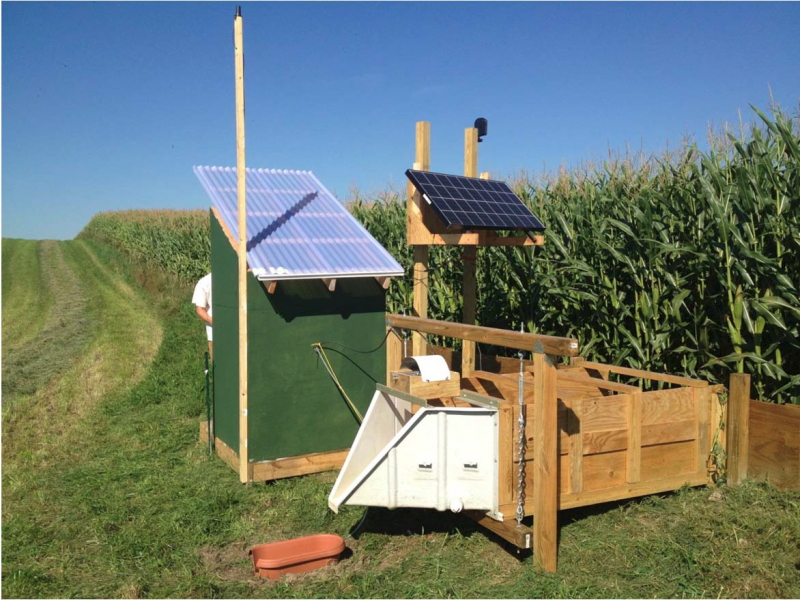
Edge of Field Monitoring Station


